Is it working?
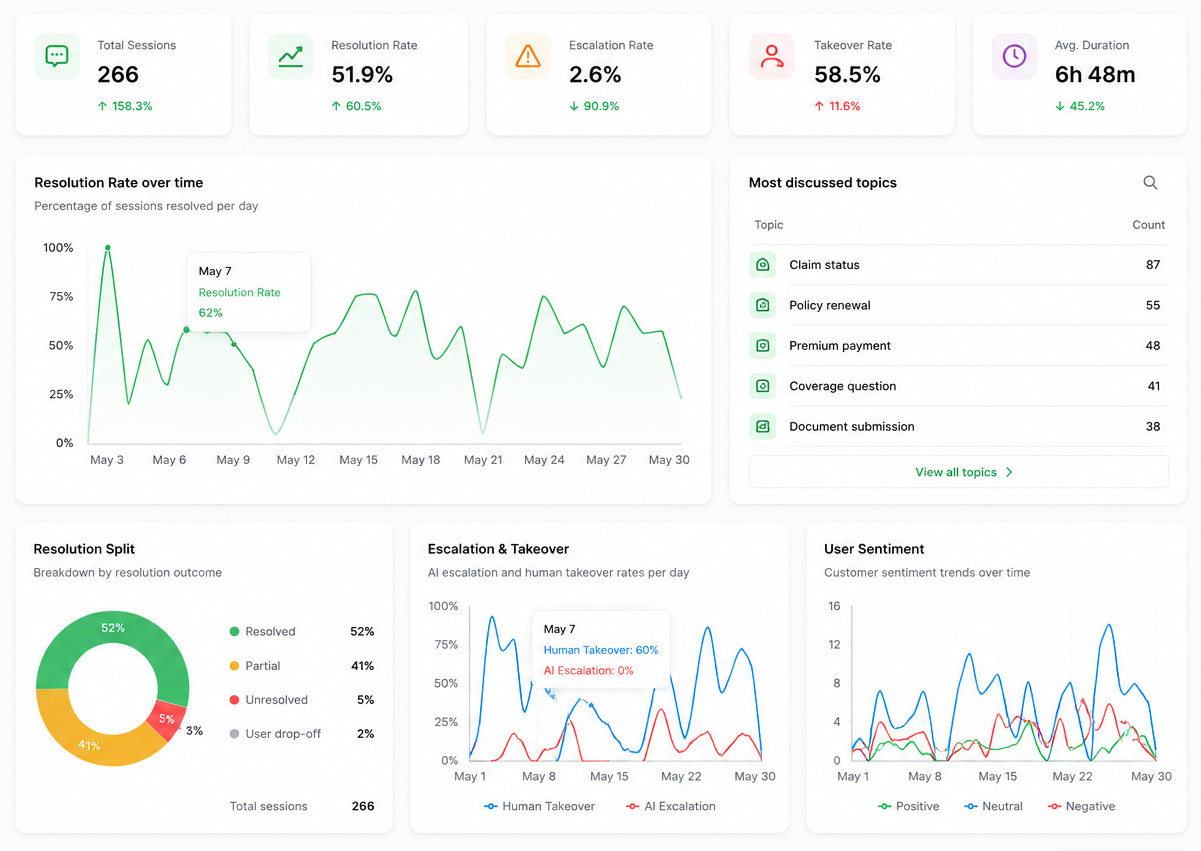
Five KPIs and trend lines show resolution, escalation, takeover, and duration at a glance.
See MorePlatform overview
Three questions every operator wants answered: Is it working? Where is it falling down? What are customers really asking? Sawabot's analytics dashboard answers them - across WhatsApp and Messenger, in one view.
AI Analytics
Five KPIs and trend lines show resolution, escalation, takeover, and duration at a glance.
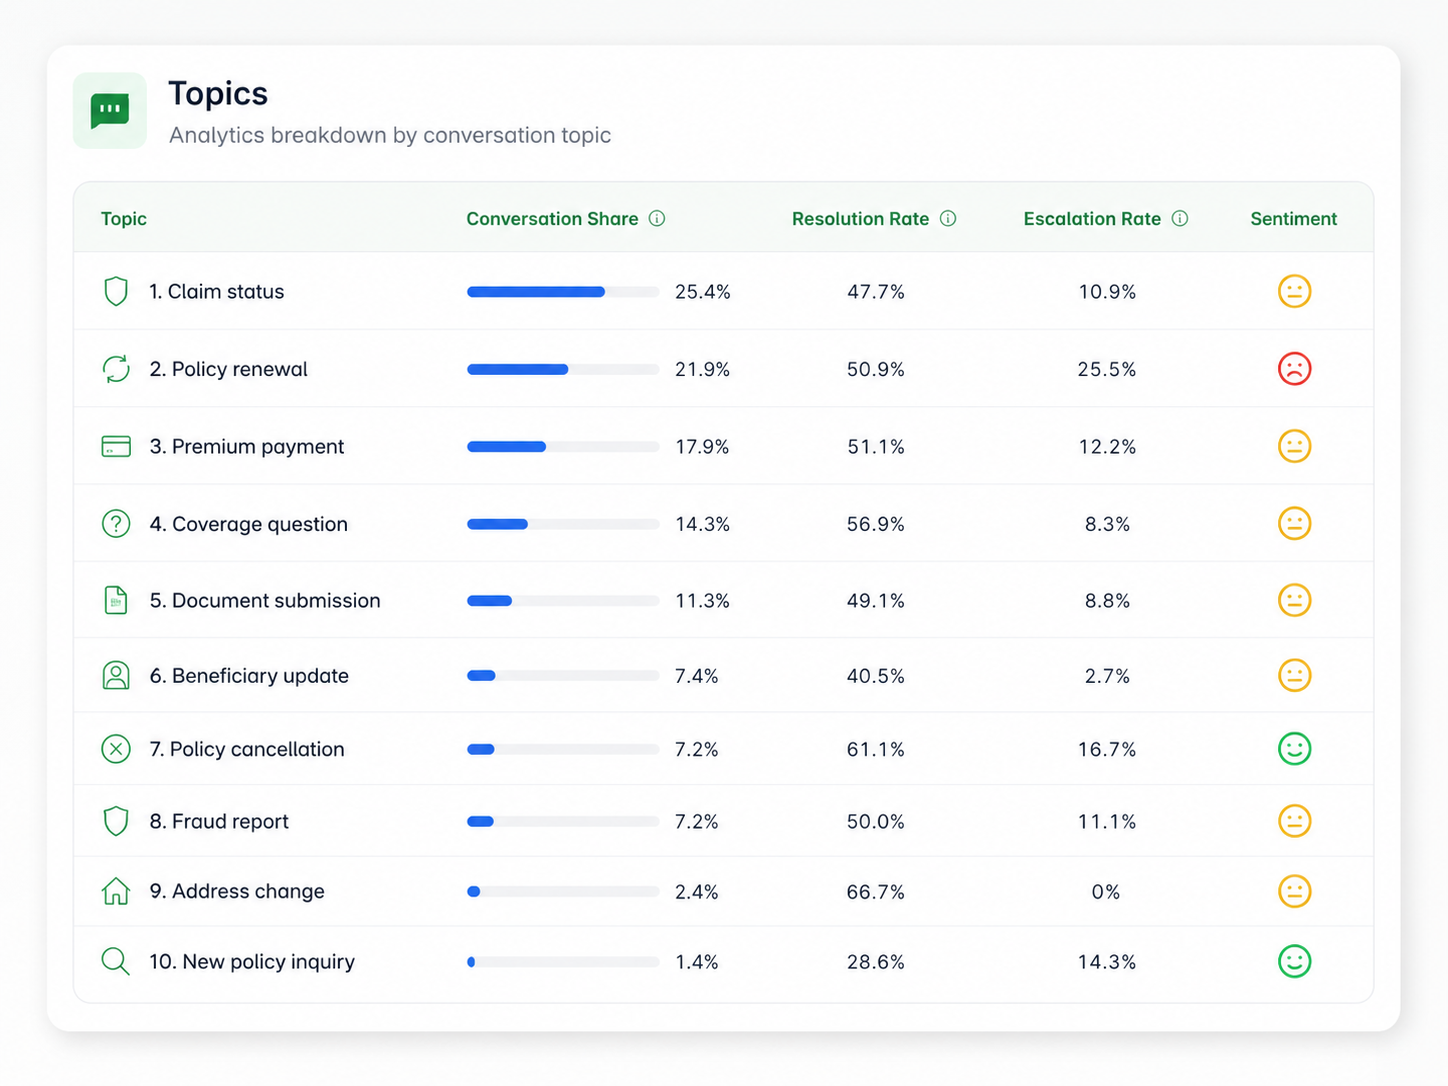
See MoreThe topics that drive your inbox, with share, resolution, and sentiment for each.
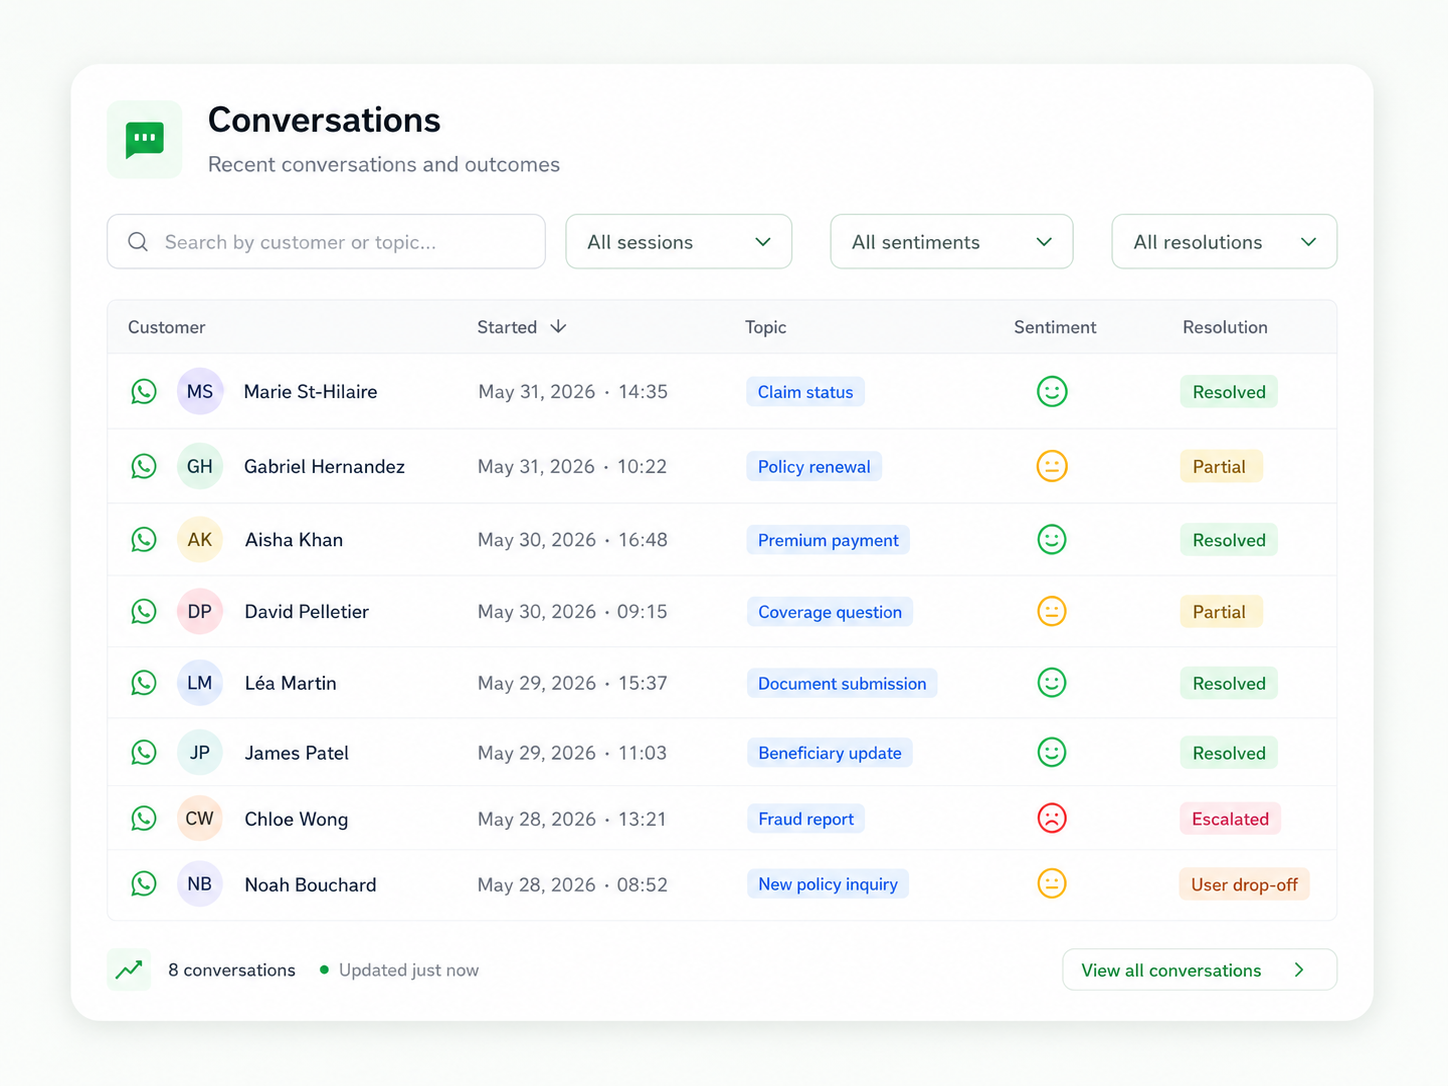
See MoreThe full transcript of every session - what the agent did, when it escalated, what the human did next.
See MoreFive KPIs on a date range you pick - Total Sessions, Resolution Rate, Escalation Rate, Takeover Rate, Average Duration. Each one shows the period-over-period delta so you can read trend at a glance. Below: a Resolution Rate line over time, a Resolution Split donut, an Escalation & Takeover bar chart, and a User Sentiment trend.
Numbers from the agent that runs Sawabot's own WhatsApp - not invented mockup data.
Topics are agent-detected categories. Sort by share to find the biggest buckets, by resolution rate to find where the agent is letting you down, by escalation rate to find what it correctly hands off.
Topics with high share and low resolution rate are where to update the instructions. The data on the right is real Sawabot data. Bilingual topics show up because our customers are bilingual.
Every session, every handover, every escalation - on the record. Filter by name, topic, status, escalation, sentiment, or resolution. Click any row to see what the agent did, when, where it escalated, and what the human did next.
Channel icons on every row - WhatsApp and Messenger together in one inbox. Flagged conversations get a flag icon at the row's start.